Ren Dexin
Space Science, ESS of USTC, China.
Ren Dexin
Space Science, ESS of USTC, China.

Direct Graphics use a graphics device (X for X-windows systems displays,WIN for Microsoft Windows displays, PS for PostScript files, etc.). You switch between graphics devices using the SET_PLOT Procedure command, and control the features of the current graphics device using the DEVICE Procedure command. Once a direct-mode graphic is drawn to the graphics device, it cannot be altered or re-used. This means that if you wish to re-create the graphic on a different device, you must re-issue the IDL commands to create the graphic. When you add a new item to an existing direct-mode graphic (using a routine like OPLOT or XYOUTS), the new item is drawn in front of the existing items.
IDL> !p.background = !p.color
IDL> !p.color = 0
;/nodata表示画出绘图框,框内不显示数据
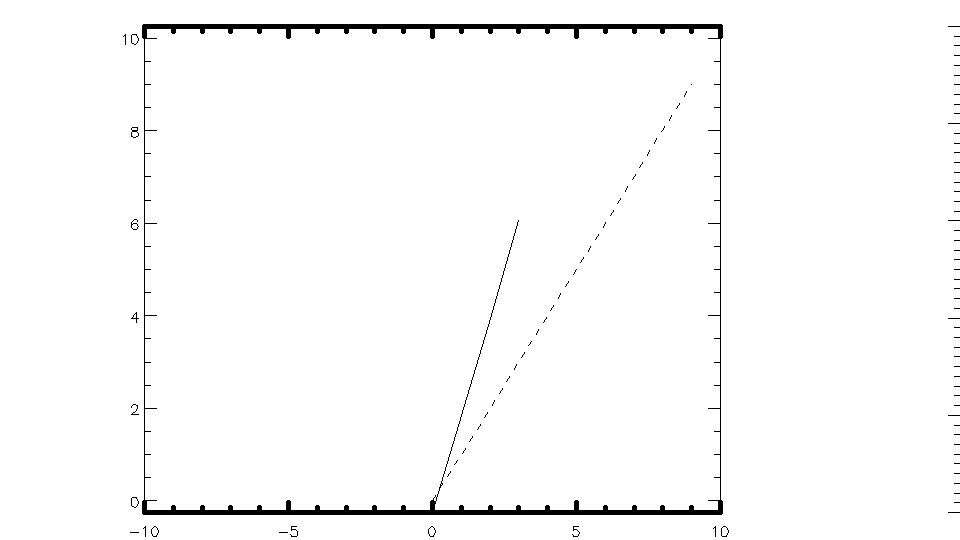
IDL> plot,[1,10],[0,20],/nodata
IDL> plot,[1,10],[0,20],/nodata
IDL> oplot,indgen(10)
IDL> plots,indgen(10),indgen(10)+3
IDL> plots,indgen(10)+9
% PLOTS: When only 1 param, dims must be (2,n) or (3,n)
% Execution halted at: $MAIN$

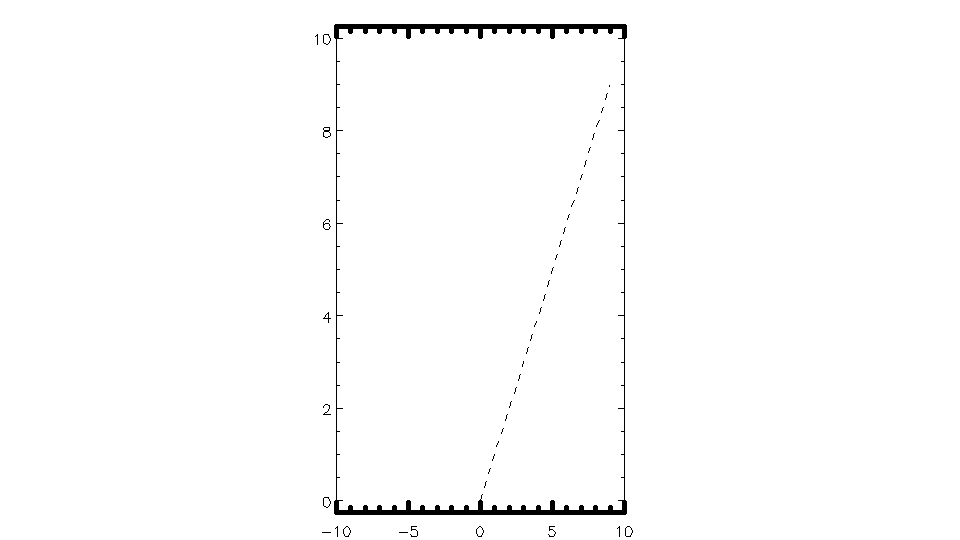
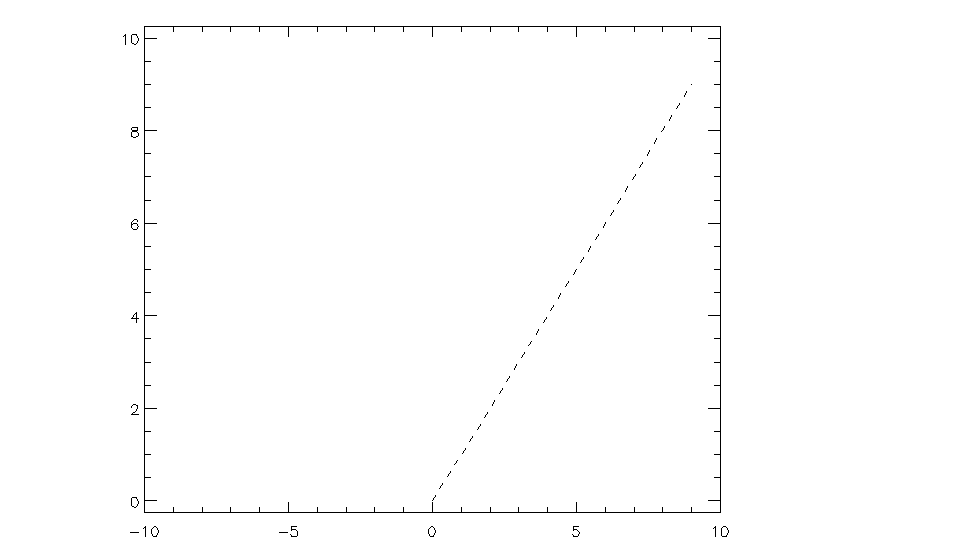
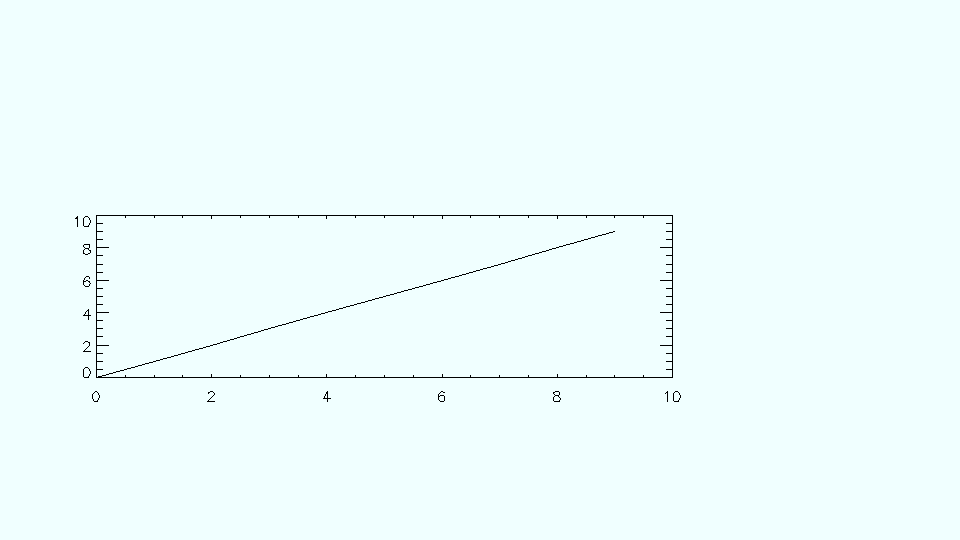
plot,indgen(10),xstyle = 1,ystyle = 2,xrange = [-10,10],
linestyle = 2,xthick = 5,position = [0.35,0.05,0.65,0.95]
[xy]style 1:坐标轴两侧为数据端点值,2:稍微扩大坐标轴范围到合适,
4:两侧坐标轴均不出现, 8:[x]上侧([y]右侧)坐标轴不出现
linestyle 0:实线 1:间断点 2:虚线: 4:-··虚线 8:长虚线(好看)
[xy]thick [xy]的坐标标度有几个
position[x0,y0,x1,y1] 默认坐标系统为/normal,均为距离左下的x0,y0,x1,y1
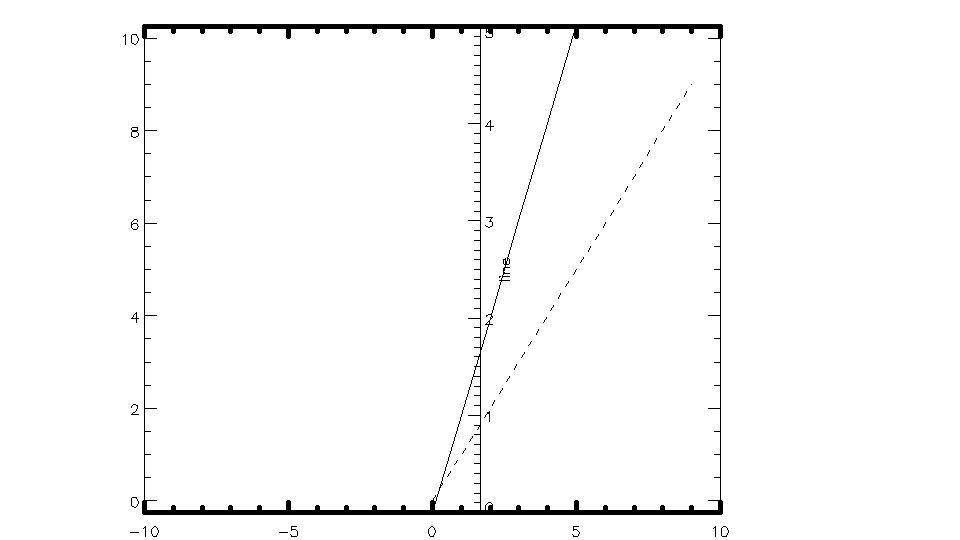
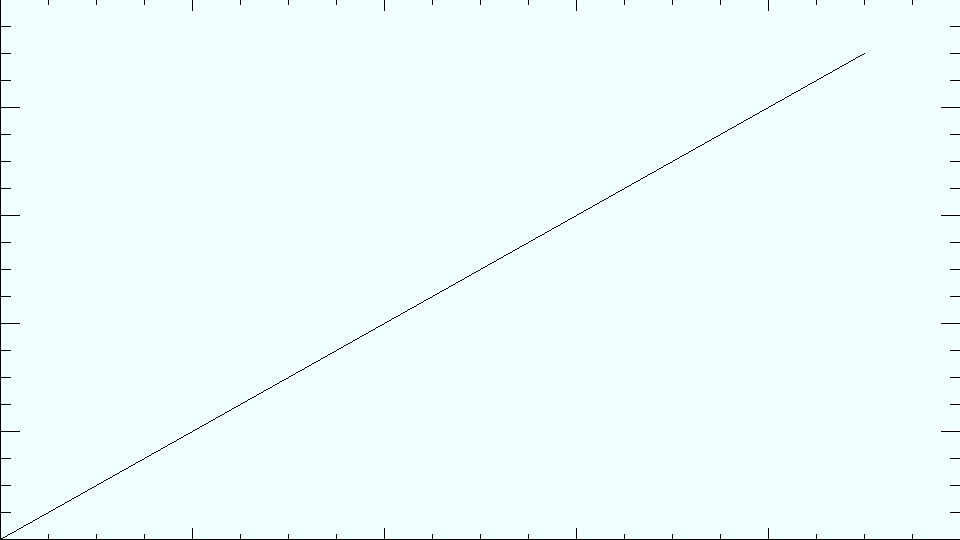
IDL> plot,indgen(10),xstyle = 1,ystyle = 2,xrange = [-10,10],
linestyle = 2,xthick = 5,position = [0.15,0.05,0.75,0.95]
IDL> axis,0.5,/normal,yaxis = 1,yrange = [0,5],/save,ytitle = 'line'
IDL> oplot,indgen(10)
axis函数添加坐标轴,不指名位置则默认在原坐标轴的另一侧.
0.5,/normal表示normal坐标系统下坐标值中间位置。
?遗留问题:如何修改y坐标右侧坐标轴的刻度长度为0,再覆盖上新的刻度
IDL> plot,indgen(10),xstyle = 1,ystyle = 2,xrange = [-10,10],
linestyle = 2,xthick = 5,position = [0.15,0.05,0.75,0.95]
IDL> axis,1,/normal,yaxis = 1,yrange = [0,5],/save,ytitle = 'line'
IDL> oplot,indgen(4)
plot,indgen(10),xstyle = 1,ystyle = 2,xrange = [-10,10],
linestyle = 2,position = [0.15,0.05,0.75,0.95]
;现在绘图的坐标框的位置,/normal坐标系下
IDL> !x.window[0]
0.15000001
IDL> !x.window[1]
0.75000000
IDL> !y.window[0]
0.050000001
IDL> !y.window[1]
0.94999999
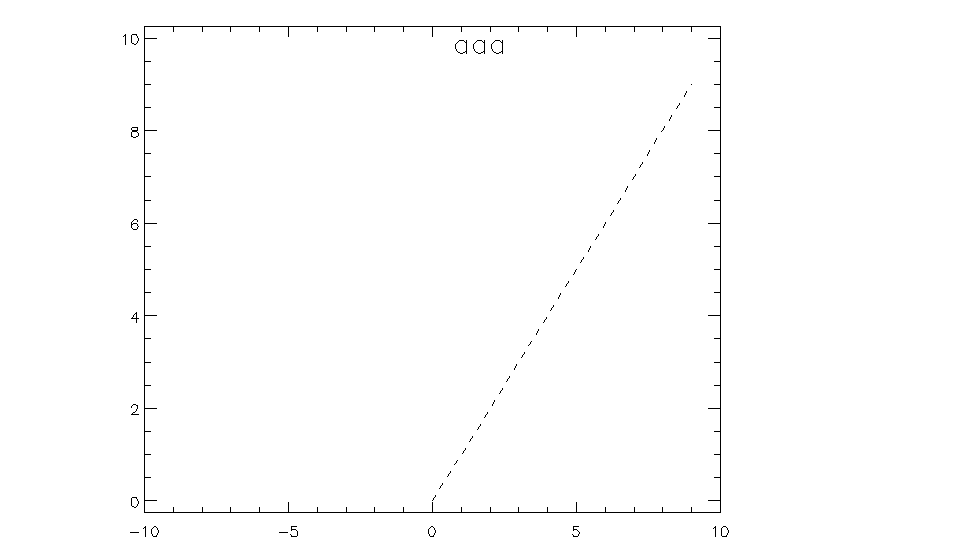
IDL> xyouts,0.5,0.9,/normal,size = 2,align = 0.5,'aaa'
;在normal的0.5,0.9坐标处下字符串,align为0左对齐,0.5居中对齐,1右对齐
/noerase
;不擦去原来的图像
/isotropic
;坐标等比例(各向同性)
overplot
;等值线画线
当图片保存为eps格式时,默认为白色背景
margin,position,regin三个函数均可以用来控制绘图范围。
!p.multi用来绘制多个图形
IDL> !x.margin = [2,3]
IDL> !y.margin = [1,3]
;margin中参数为距离边界的字符数
IDL> plot,indgen(10)
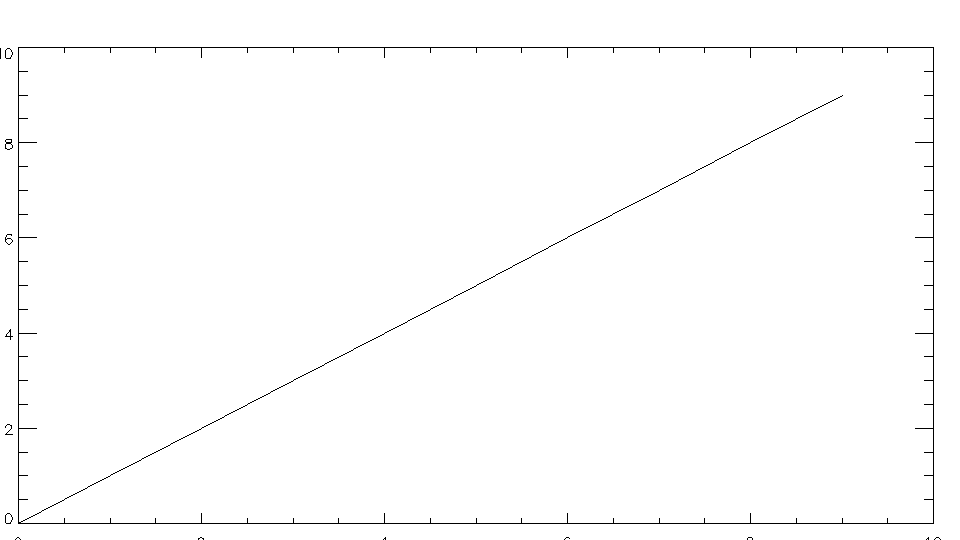
IDL> plot,indgen(10),position = [0.1,0.3,0.7,0.6]
IDL> plot,indgen(10),position = [0,0,1,1]

IDL> plot,indgen(10),xmargin = [0,0],ymargin = [0,0]
;omargin用来设置总的绘图框距离边界的字符数
IDL> !p.multi = [0,2,2,0,1]
IDL> ;2*2子图,最后一个1表示按列画图
IDL> !x.omargin = [0,0]
IDL> !y.omargin = [0,5]
IDL> plot,indgen(10),xmargin = [0,5],ymargin = [3,0]
IDL> plot,indgen(10),xmargin = [0,-5],ymargin = [0,-5]
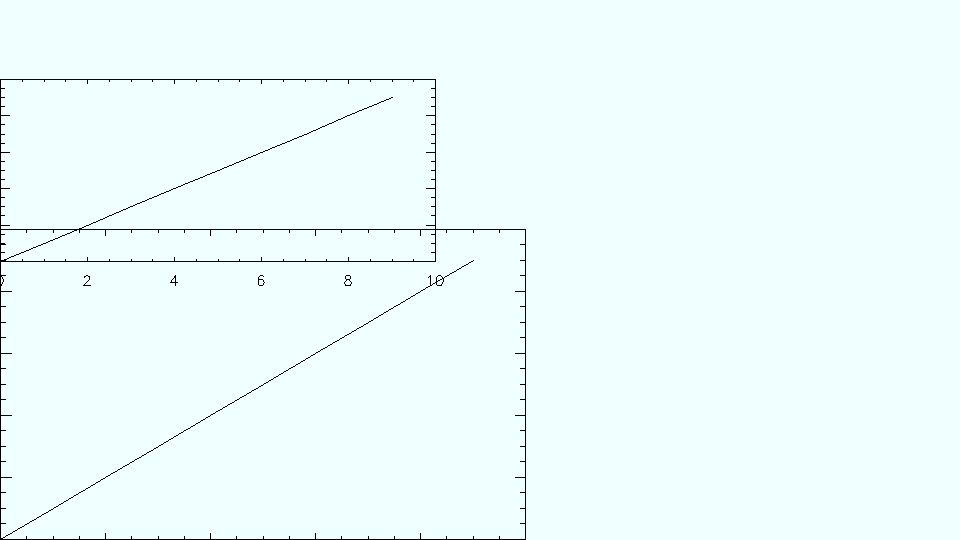 ;接着上一个图
;要删除一个字符串,使用color = !p.background覆盖
IDL> !p.multi = [1,2,1,0,0]
IDL> plot,indgen(10),xmargin = [0,3],ymargin = [3,-5]
IDL> xyouts,0.5,0.9,/normal,'hello ustc'
IDL> xyouts,0.3,0.9,/normal,align = 0,'hello ustc'
;接着上一个图
;要删除一个字符串,使用color = !p.background覆盖
IDL> !p.multi = [1,2,1,0,0]
IDL> plot,indgen(10),xmargin = [0,3],ymargin = [3,-5]
IDL> xyouts,0.5,0.9,/normal,'hello ustc'
IDL> xyouts,0.3,0.9,/normal,align = 0,'hello ustc'

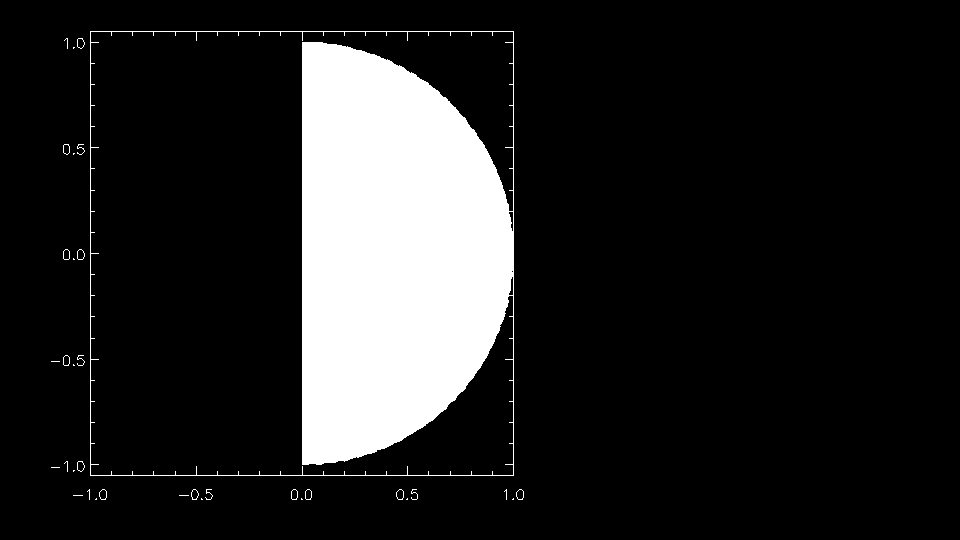
;polyfill给一个闭合区域添加颜色
;/isotropic等比例
IDL> theta = (findgen(181) - 90 ) / 180. * !dpi
IDL> x = cos(theta)
IDL> y = sin(theta)
IDL> plot,x,y,xstyle = 1,ystyle = 2,xrange = [-1,1],linestyle = 2,/isotropic
IDL> polyfill,x,y